Seeking the Alpha - PLTR vs. NOW
Some companies are great, others are Alpha. The investment thesis on Palantir bets on its ability to become Alpha. What if there are already signs of it?
Editor: @Emanuele20x
Leaders are leaders for a reason.
Regardless of the field, leaders are the best in what they do and this leads to superiority in results.
Therefore to identify emerging leaders, it is essential to spot some early signs of strengths in what they do when the general perception still does not give them enough credit for their results. These signs of strengths will be the key driver for future performance, which will be finally appreciated by the mass when results will be too good to ignore.
I believe comparing Palantir with an established winner in the IT B2B space could provide clues on its true potential.
ServiceNow ( NOW 0.00%↑ ) mainly provides Enterprise tools for Workflow optimization, so it competes with Palantir for companies and Governments on IT Budgets.
NOW has impressive unit economics which lead it to outstanding operating results and as a consequence price performance for the stock, which delivered +1.600% since IPO in 2012.
NOW is an $85bn company with ~$6bn Revenues. Palantir has a market cap of $15bn and ~$1.5bn Revenues, so NOW is ~4x bigger.
Why ServiceNow is the (high) yardstick
NOW is one of the best B2B SaaS businesses, an absolute leader in IT service management (“ITSM”) with a 40% market share and expanding in adjacent businesses, namely Customer/Employee Workflows and Creator Workflows, to capture a bigger share of Corporate budgets.
I consider NOW not only the closest comparable as a B2B SaaS to Palantir, but also the benchmark Palantir needs to exceed if it wants to achieve its goal of becoming the operating system for the modern enterprise.
NOW, in my opinion, is a better comparison than Salesforce ($CRM) due to stronger financial numbers (more similar to Palantir’s) and their platform focus.
NOW success is evident in a few crucial numbers:
+30% Revenues 5y CAGR to $5.8bn;
+30% FCF Margin;
+7000 clients, of which 80% of Fortune 500.
Better than “great” equals Alpha?
Palantir becoming a truly dominant business is not only the wildest dream of investors -like me-, but it is supported by early signs in the numbers and qualitative assessments.
In particular, I believe Palantir is an Alpha in the making for this three main reasons:
Better unit economics despite the much smaller size;
Superior offering;
Better network effects.
This article will focus on the first point since there is so much to uncover that required a deep analysis.
I will address the more qualitative considerations in a second article.
Palantir has superior unit economics despite its small size.
Scale in software matters: a 4x bigger company like NOW should have much better unit economics than Palantir.
Conversely, if Palantir unit economics are at least similar to NOW, that could be an early sign of strength.
I believe comparing these metrics could be helpful to address the relative strength of a SaaS business:
Revenues per Employee;
Revenues per Client;
Revenues per Salesperson;
Revenues per New Client;
Marketing Efficiency;
Rule of 40.
Many metrics are focused on Revenues because the ability to collect Revenues with fewer resources is a key driver for the business expansion, especially for a recurring business like SaaS.
Revenues per Employee
This metric shows how much value each employee could deliver. Since the software is a scalable structure, this ratio should increase along with scale expansion.
Since we don’t know the full breakdown of Government vs Commercial employees, in this analysis I consider Palantir as a group.
Each Palantir employee delivers much more value and it could further increase as the business scales.
Each Palantir employee delivers, on avg., $528k Revenues, +50% compared with NOW’s $353k and the number is increasing steadily.
This, however, clearly comes at a cost. In particular, Palantir SBC per employee of $270k is very elevated compared with $70k of NOW.
As discussed in a previous article, the best talents deliver asymmetrical results but must be compensated and aligned to corporate goals. However, as Palantir grows, SBC should have a lower marginal impact because Palantir will need relatively fewer people to bring new Revenues.
Interesting fact, Palantir’s Revenues per employee are already 21% higher than CRM 0.00%↑ ’s on +$25bn Revenues.
Revenues per Client
The average Palantir client generates 8x more Revenues than NOW’s.
Palantir's average revenues per customer on its 237 clients as of ‘21 is $6.5mn, compared to $0.8mn of NOW. This comes despite Palantir increased its clients by 71% YoY (vs +7% YoY for NOW), which “dilutes” the average.
Palantir numbers are still superior even if we exclude NOW’s clients with less than $1mn/year Revenues ($3.8mn on avg. compared with $6.5mn of Palantir).
However, Palantir avg. per client could decrease going forward as a result of modularization and consumption-based-pricing to pursue client growth more aggressively.
This would not be negative if associated with a strong increase in the number of clients, because each client could become increasingly more valuable in time as it purchases more modules or consumes more.
As a reminder:
Palantir Revenues = number of clients * avg. revenues per client.
Another clue of Palantir's strength comes from the newly acquired clients in Q1.
The new 40 clients already delivered on average $450k. If we annualize this, it is $1,8mn/year, so more than 2x the Average Revenues per client of NOW (without considering contract expansions!). Thank you @NickButeas for pointing me in this direction.
How can Palantir achieve such high-ticket deals?
Shyam, Palantir COO, has a simple answer to explain their pitch:
How much would you be willing to spend for a tool that makes you save $50mn? If you pay $10mn you are already getting a deal.
When you “sell outcomes” you can demand a very high price if you succeed.
The devil is in details:
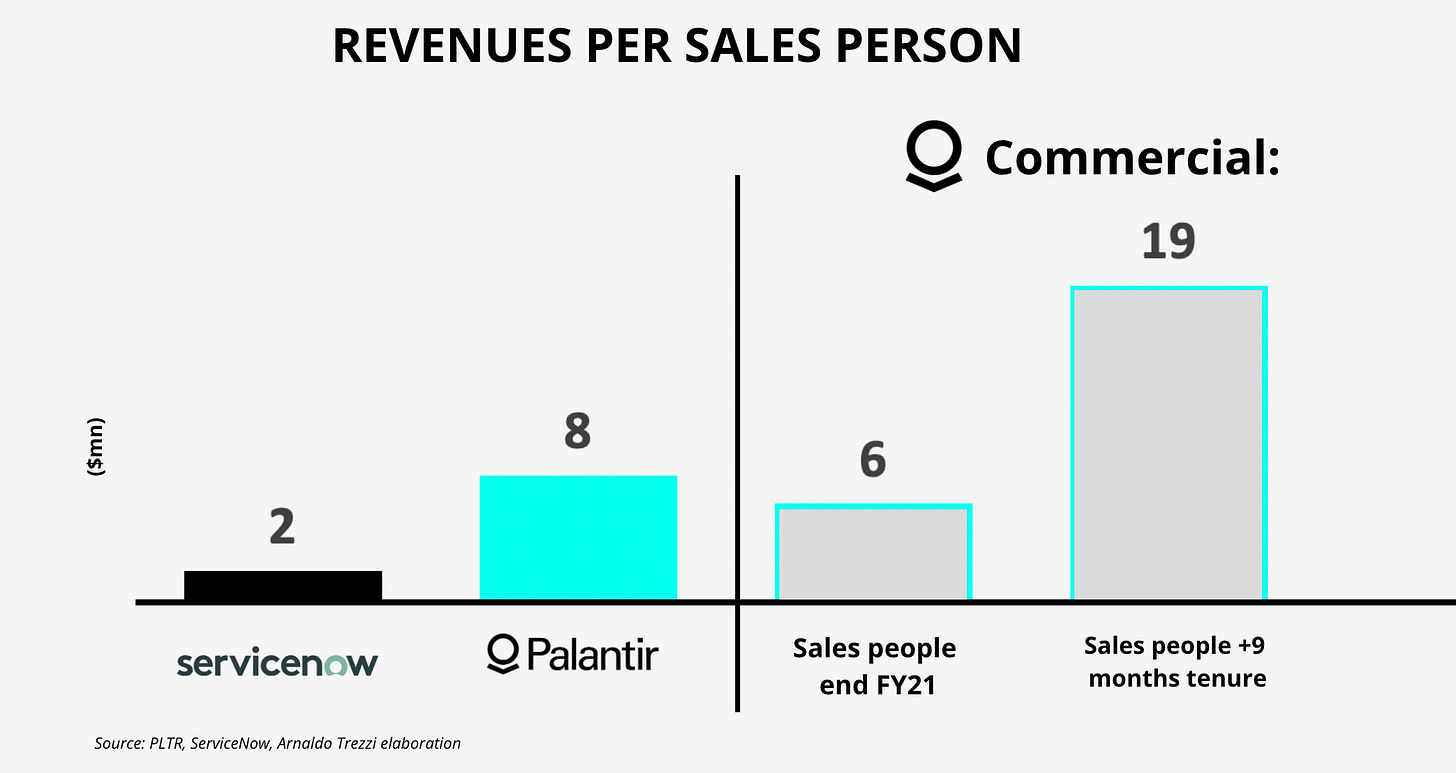
Revenues per Salesperson
What is even more staggering is that Palantir Revenues are generated with a tiny Salesforce. Both Palantir and NOW companies rely also on third-party sellers like Accenture, so the numbers are not going to be precise. However, they provide a clue of how valuable an additional sales person could become.
Revenues generated in 2021:
Palantir: 203 sales people generated $1.5bn = $7.5mn per sales people
NOW: 3174 Sales people generated $5.9bn = $1.9mn per sales people
If we assume $7.5mn per salesperson with the same number of salespeople as NOW, Palantir could generate $23bn in a year, similar to CRM Revenues.
We can dig deeper:
Palantir Commercial generated $645mn Revenues in ‘21, with 109 salespeople, of which 34 have +9month tenure (the minimum to be operative). Therefore, $5.9mn per salesperson or $19mn per Salesperson with +9 month tenure.
Imagine you are a salesperson in B2B Tech, wouldn’t you be attracted to these numbers? No wonder Palantir has been able to attract top leaders from other B2B companies like the Ex-Country Head of Salesforce Swiss.
The way up is always more difficult!
NOW and Palantir pursue very different approaches in their go-to-market strategies.
NOW is focused on mass adoption with low-ticket clients, while Palantir is using the Tesla playbook “start from the niche, high-paying clients and then scale down”.
The avg. revenue per client is crucial because Palantir could potentially reach the same number of clients as NOW with a “cheap offering”, while the inverse could be very difficult for NOW. The way up is always more difficult!
Imagine how much more difficult it is for FIAT to sell a high-end car than it is for a Mercedes to sell an “affordable” car.
In other words, if you can obtain $100mn/y per client (as Palantir receives from its top 3 clients) it is easier to sell a lower ticket item than the other way round.
Diversely from a Ferrari, Palantir is a “luxury product” which could be scaled indefinitely without compromising its “status”.
Palantir marketing shows the power to scale
Despite the fact that this could surprise many -myself included- Palantir marketing works!
Sales Efficiency
NOW ranks among the best cloud software peers with a 3.7x Sales Efficiency ratio, well above the 2x peers' average. Sales Efficiency is a measure to express how effective Sales&Marketing (“S&M”) excluding SBC are in order to generate future Revenues.
For instance, a Marketing Efficiency of 3.7x means that each incremental $1 spent in S&M delivered $3.7 more Revenues in the year.
Sales Efficiency = Delta Revenues / Delta S&M
NOW Sales Efficiency increased with size: from 2.9x at +$1bn Revenues to 3.7x at ~$6bn Revenues.
Palantir at ~$1.5bn Revenues in ‘21 achieved 5x Marketing efficiency, despite the smaller size (theoretically more inefficient). Remember the cash preserved thanks to SBC? Given the high marketing efficiency, this cash could be used to boost growth by doing more events, pilots, or recruiting top tier sales people.
According to my estimates*, which see a ~45-55% split of Marketing Expenses between Commercial and Government, Palantir Marketing Efficiency is composed of:
5.0x from Commercial.
5.5x from Government.
*from the Contribution Margin of each division assuming the same Gross Margin
These numbers support my thesis that the Commercial business is stronger than it seems (Q1 analysis), despite Foundry being launched only in ‘16.
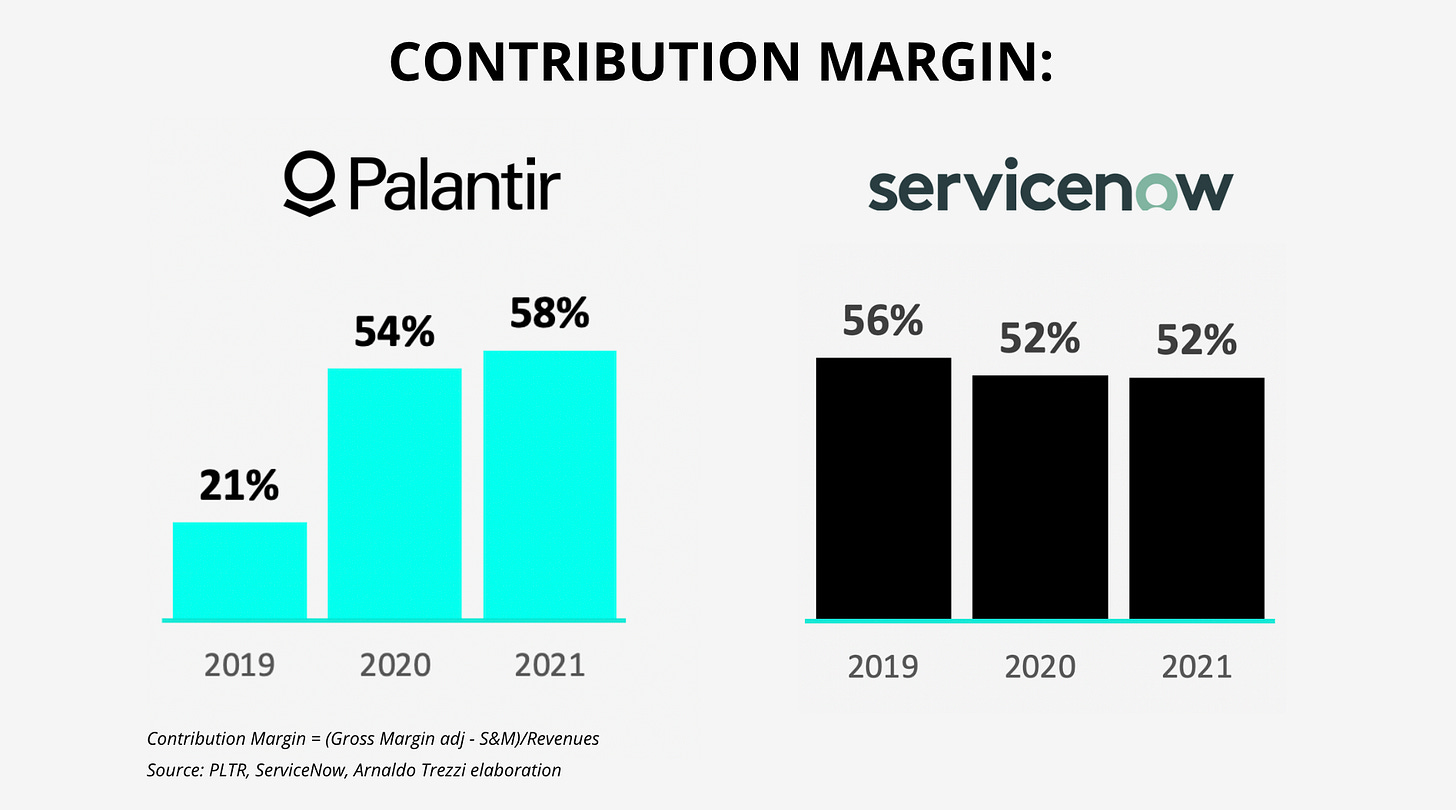
Contribution Margin
Another way to look at Palantir’s ability to deliver software is by looking at Contribution Margin, which according to Palantir is the main metric to assess their efficiency in software distribution.
Palantir made a huge improvement in the last two years, from 21% in ‘19 to 58% in ‘21 which is above the 52% of NOW, driven by the dramatic decrease in time needed to deploy Palantir to clients. For instance, Hyperauto allows creating ontologies in hours or couple of days while it took weeks or months before. Faster deployment means easier sales and less valuable time spent assisting clients in setting the platform.
Despite many are still convinced PLTR is a consultancy, Palantir is software and a highly distributable one. Numbers speak. The old “consultancy” component was needed to create the software.
Efficiency Ratio - “Rule of 40”
One final metric is the Efficiency Ratio from the “Rule of 40”. This rule says that great SaaS businesses show a mix of Revenue Growth combined with FCF Margins above 40%. The idea is that SaaS companies generally have the tradeoff between growth and margin expansion (lower expenses). In this way, companies who are able to grow substantially while having high FCF Margins are superior.
NOW leads the SaaS category with a 62% Efficiency Ratio. Palantir does even better with 69%.
Conclusion
From the analysis of financial metrics, there are signs of strength in Palantir’s numbers despite their much smaller size.
As Palantir increases scale, the divergence could become even stronger and create a strong tailwind for boosting growth above the Guidance of +30% Revenue CAGR.
NOW numbers point to a steady growth machine. Palantir has not only steady growth on its side but also the option to fully explode if its flywheel keeps spinning faster.
The higher optionality comes however with execution risk, from a financial standpoint a risk due to SBC.
To summarise, NOW is a great company. Palantir provides convexity.
“There is no reason this company shouldn’t be 20x bigger”.
Karp
Financial numbers are helpful, but if we want to have a more holistic picture of the strength of Palantir we should also focus on the product side and the potential network effects which could be the drivers for growth.
So here comes the second part. Don’t miss it!
Yours,
Arny
Join me on Twitter: @arny_trezzi
View expresses are my own. Do not represent Financial Advice.
I own PLTR 0.00%↑ stocks.


Wow.