Palantir's Money Machine Needs Scale
Gross Margins hint at Palantir's FCF potential
Editor: Emanuele Marabella
Hi, I’m Arny. If you are new, you can subscribe to spot Palantir asymmetries along with 1.153 investors. Please hit the ❤️ button if you like today’s article.
Paid subscribers also receive weekly in-depth research on Palantir’s financials and strategy. Do you have questions arising from my research? Please book a 1-on-1 meeting.

Book a meeting with Arny Trezzi
In this article:
Gross Margin Explained;
SaaS El Dorado;
Palantir Operating Leverage.
Not all leverage is bad.
Palantir announced it will release its 22FY numbers on the 13th of February. I will stream that live on my YouTube channel.
To arrive prepared, in this article, we will dissect Palantir’s most important metric that is shown in each earnings slide deck. Gross Margins are always highlighted in Palantir financials, but what exactly are Gross Margins, and why are they so crucial?
Gross Margin is a crucial metric because it hints at Palantir’s FCF potential.
By understanding how Gross Margin works, we can better assess if Palantir is not only increasing in size but also increasingly more profitable at an operating level.
To complement what we share here I highly encourage you to read what I call "the definitive guide of SaaS Income Statements" by OnlyCFO .
Gross Profit
Gross Profit is calculated by subtracting the Cost of Revenue from Revenue.
“Cost of Revenue primarily includes salaries, stock-based compensation expense, and benefits for personnel involved in performing O&M and professional services, as well as third-party cloud hosting services, allocated overhead, and other direct costs”.
Palantir’s 10k.
In the case of Palantir, in line with other SaaS companies, the Cost of Revenue is made up of the following:
Third-party cloud hosting like AWS, Azure, and GCP (“Cloud”);
Professional Services (“Consultancy”);
Operating and Maintenance (“O&M”).
Unfortunately, we don’t have the precise mix of the Cost of Revenue.
We can also see Gross Profit expressed as a percentage of Revenue. This favors the comparison with other companies in the sector.
Gross Margin = Gross Profit / Revenues.
As mentioned many times, SBC does not affect Palantir’s FCF but does affect GAAP financial numbers (When Will Palantir SBC Ease?). Therefore it is worth remembering the distinction:
Gross Profit GAAP: includes the negative effect of SBC from Cost of Revenues;
Gross Profit adj.: excludes the negative effect of SBC from Cost of Revenues.
The crucial thing to remember is that the higher the Gross Margin the more “buffer” for profits after expenses.
Down to EBIT Margin
From Gross Profit Adj. we can arrive at Operating Earnings Adj. (“EBIT adj.”) by subtracting the Operating Expenses (“OpEx”):
Sales & Marketing (“S&M”);
General & Administration (“G&A”);
Research & Development (“R&D”).
EBIT Adj., can be considered a proxy to FCF with SaaS businesses like Palantir that have virtually no Capex as they don’t invest in physical infrastructure.
By subtracting the SBC related to the Cost of Revenue and Operating Expenses we obtain EBIT GAAP, which is negative and represents a ~13% GAAP Operating Loss in the Income Statement.
This clarity allows us to understand the engine that drives the numbers.
SaaS El Dorado
SaaS companies seek operating leverage.
SaaS businesses have relatively little Cost of Revenue, which is a variable cost that necessarily tracks the Revenue. Gross Margins tend to be very steady and slightly improve over time.
On the other hand, Operating Expenses have a high incidence and are mainly fixed costs, especially R&D and General&Admin.
“Operating leverage means do more with less”. - Mostly metrics
Regardless of the size, SaaS businesses need substantial Operating Expenses in absolute terms to create products and market them, but their incidence gradually reduces as the business scales.
SaaS businesses require substantial scale to generate significant FCF.
Palantir's Gross Margin over time
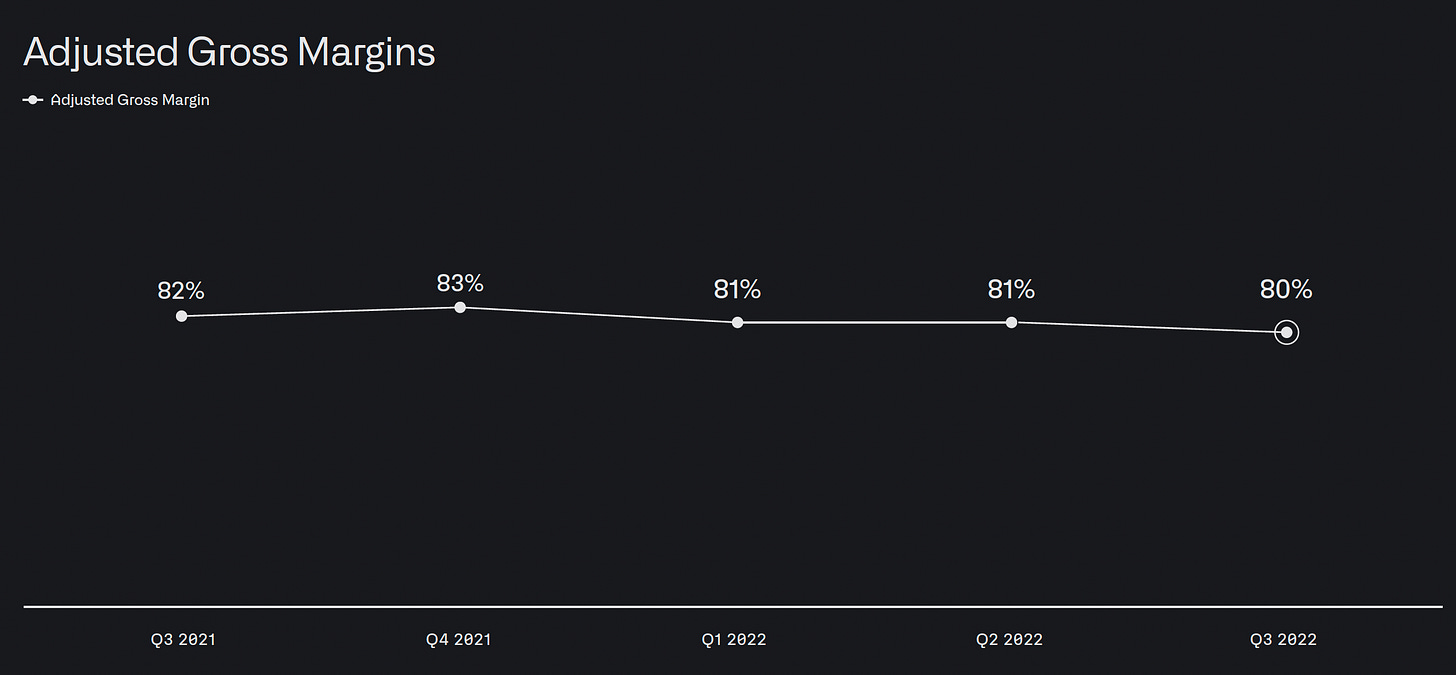
Palantir's Gross Margin steeply increased in 2020, thanks to higher efficiency and Apollo (Palantir’s Apollo, the Trojan Horse). Gross Margin now stands at ~80%.
Interestingly, Palantir's Gross Profit is increasing substantially more than Operating Expenses.
Palantir is benefitting from a positive Operating Leverage.
In other words, Gross Profits are growing more than the costs needed to generate that growth.
By aggregating the costs under “Operating Expenses” we can see how Palantir’s cash machine is scaling despite the fact that they are investing heavily in foreign expansion in Europe and South Asia and in acquiring new customers, which account for substantial initial costs (Palantir Mistakes: a Matter of Survival).
Keeping track of these dynamics is crucial to truly assess if Palantir’s FCF machine keeps improving and advancing toward the “Long range target model.”
Palantir could achieve its ~85% Gross Margin target by:
Increasing in size;
Better managing their terms with cloud providers;
Reduce the “consultancy” component.
The fact that ServiceNow already has an ~85% Gross Margin on its Subscription business shows that the target is achievable. Clearly, it is a matter of execution that needs to be monitored.
How does Palantir’s Gross Margin relate to those of its SaaS peers? Stay tuned.
“What I think is going to happen is we are going to have a couple years of terrible times, those companies that are most robust will survive and thrive, you'll get credit for it in a couple years”- Alex Karp, Palantir CEO.
Yours,
Arny


great breakdown of the P&L with a clear use case ... thanks!